
The State of Small Business Websites in Southeast Asia
We audited 35 SEA small-business websites. The average Conversion Score was 35/100 — see what separates the best from the rest.
Start for Free
In short
OhhWells audited 35 small-business websites across Southeast Asia and found an average Conversion Score of 35 out of 100. Trust signals and calls-to-action were the most common weak points, and fintech/SaaS sites scored far ahead of professional-services firms in the same sample.
Key takeaways
- The average small-business website we audited scored 35/100 on the Conversion Score — and the median (38) means half of all sites fall below that.
- Trust Signals & Social Proof was the single most commonly flagged weakness, showing up in roughly two-thirds of audited sites — most often as a complete absence of testimonials, client logos, or case studies anywhere on the page.
- Professional-services businesses (law, consulting, HR, corporate services) averaged 28/100 across the 14 we audited — less than half the score of the 5 fintech/SaaS companies in the sample, which averaged 62/100.
- The gap between the top decile (62) and the median (38) is 24 points. The pattern behind it isn't sophisticated copywriting — it's basics: one clear CTA above the fold, visible trust signals, and a headline that states what the business actually does.
- Four sites scored 8/100, the lowest in the sample — in each case because of missing fundamentals (no H1 tag, no CTA, no value proposition, or content that failed to render at all), not subtle conversion-optimization gaps.
- We can't yet report a reliable country-by-country breakdown — most of the businesses audited don't have a confirmed home market from their domain alone, and we'd rather say that than guess.
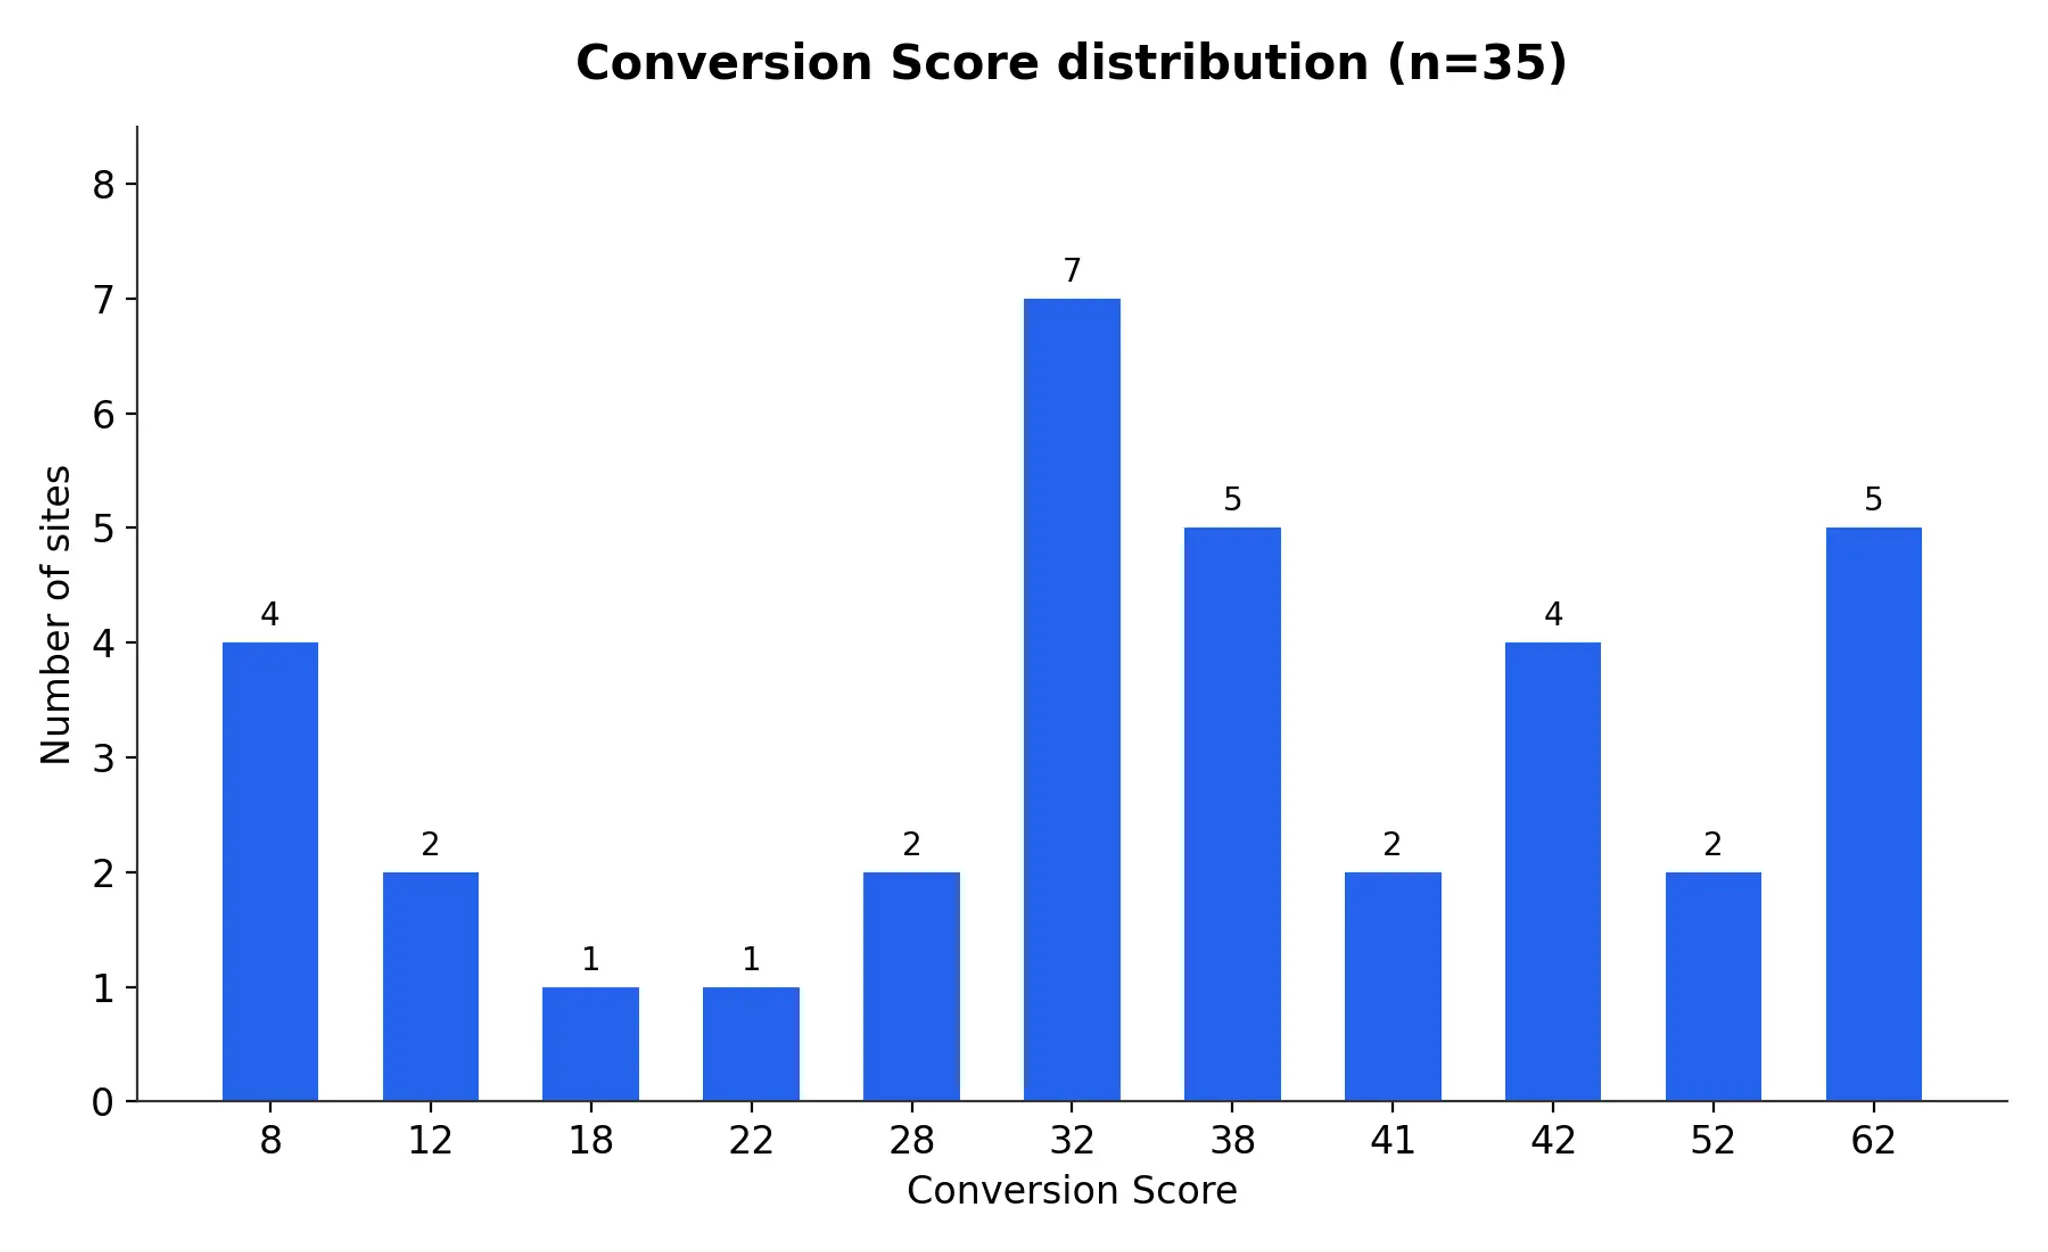
Score distribution chart: Scores ranged from 8 to 62 out of 100.
What is the Conversion Score?
The Conversion Score is a 0–100 rating of how effectively a small-business website turns visitors into enquiries or customers. It evaluates 32 checks across 8 dimensions: Value Proposition Clarity, Headline & Messaging, Call-to-Action Effectiveness, Visual Hierarchy & Scannability, Trust Signals & Social Proof, Brand Consistency & Identity, Objection Handling, and Friction & Page Experience. It's generated by OhhWells' free website audit tool and benchmarks small-business sites on the factors most associated with conversion.
How do SEA small-business websites score overall?
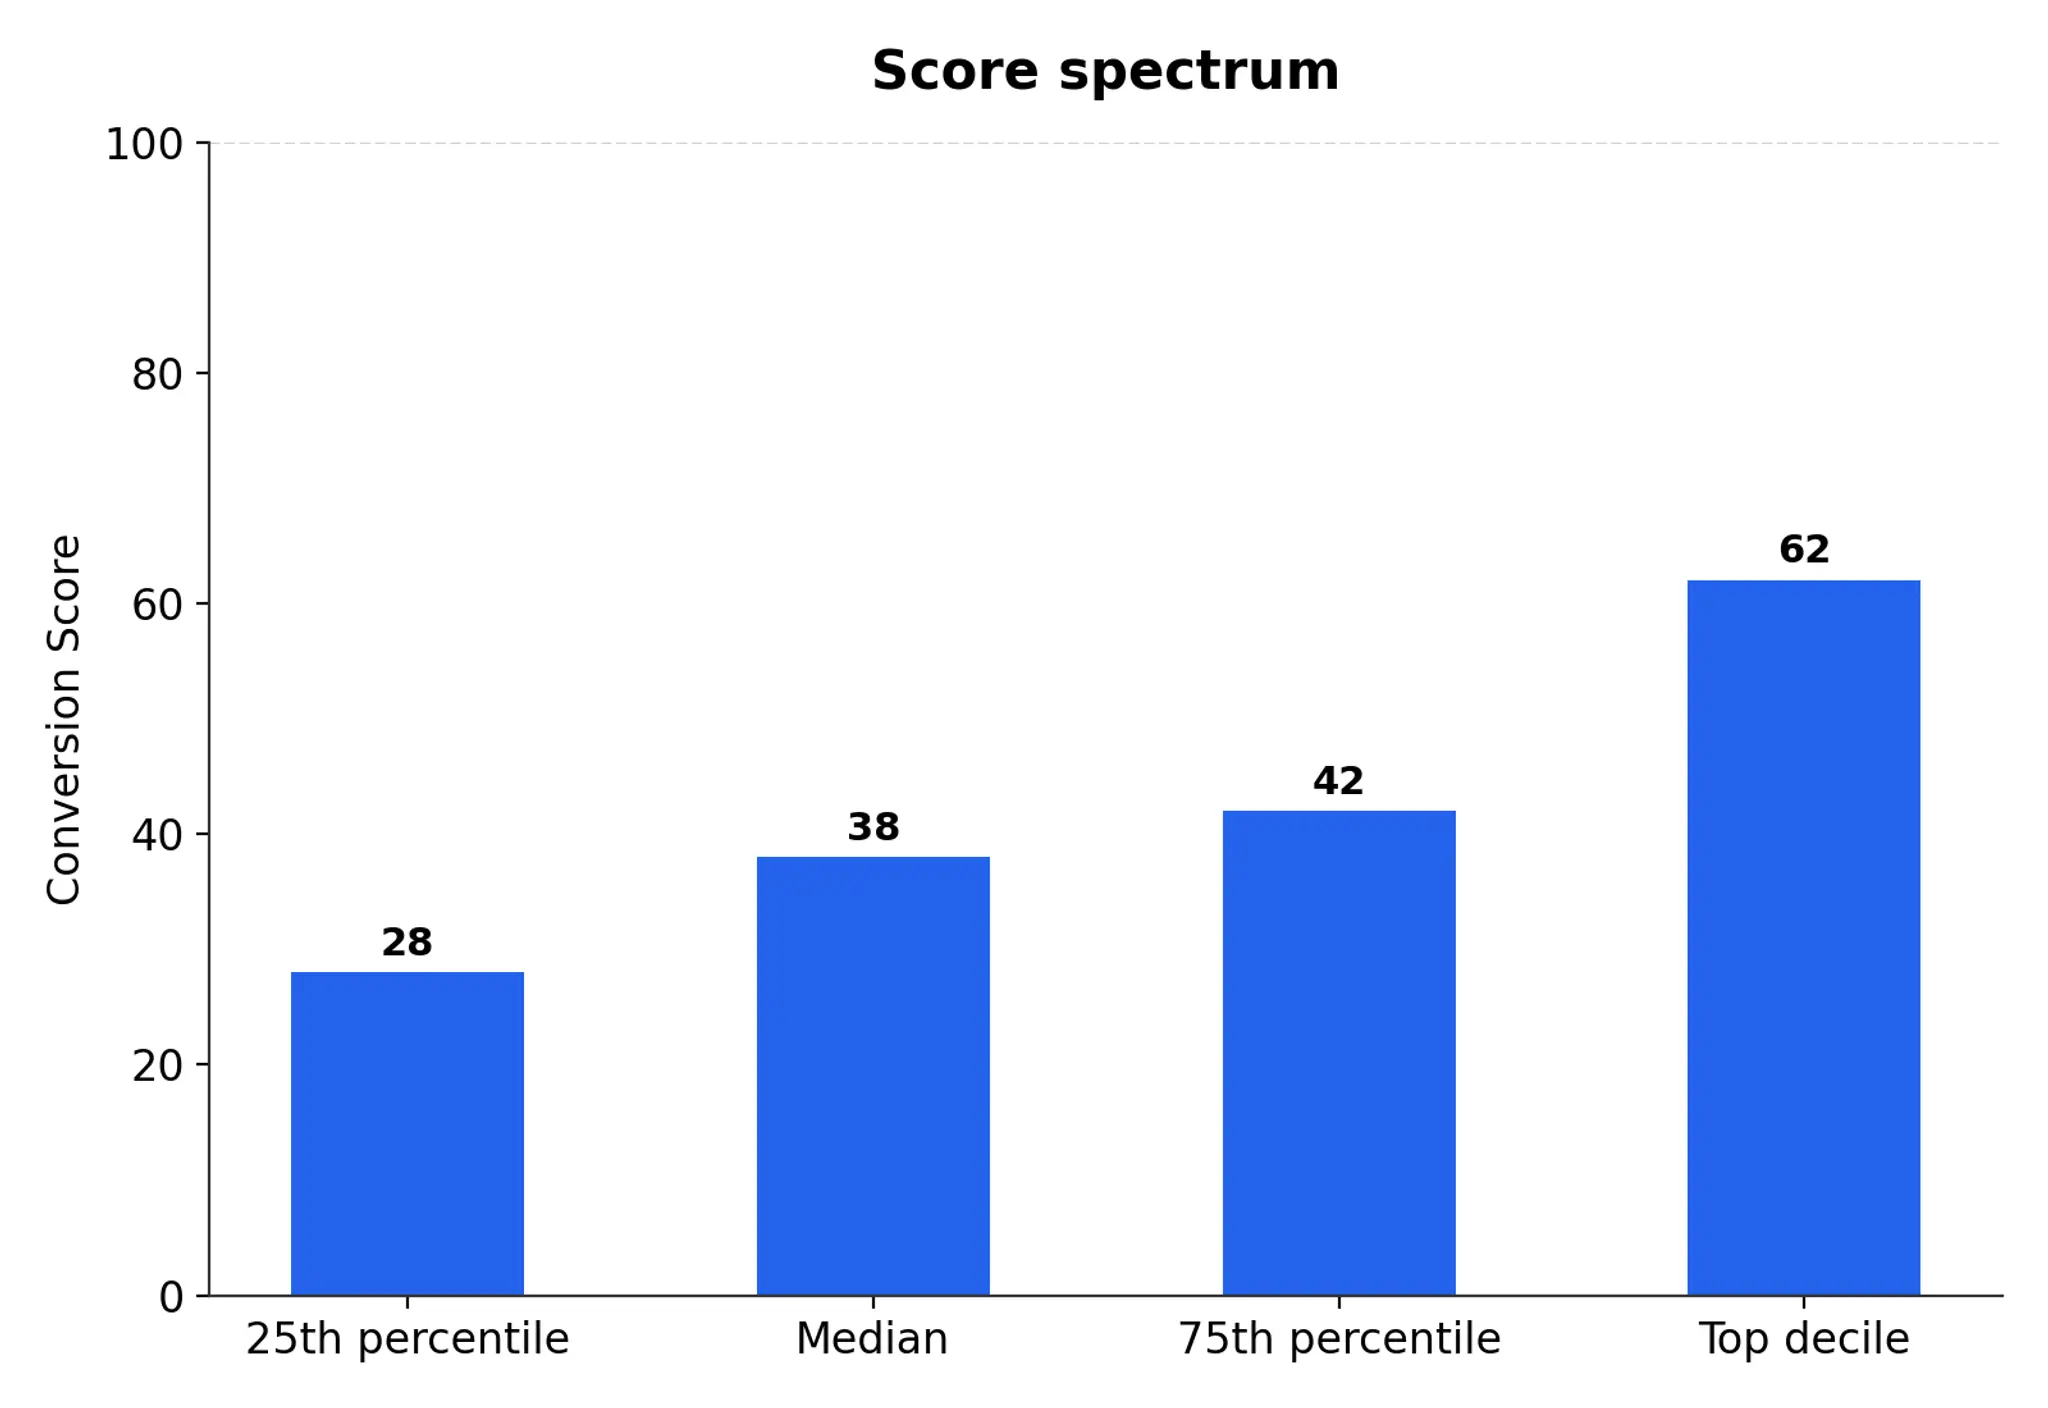
The average Conversion Score across the 35 sites audited was 35/100, with a median of 38/100 — meaning half the businesses we looked at scored below 38 out of 100.
The spread is wide. A quarter of sites scored 28 or below; a quarter scored 42 or above; the strongest performers (top decile) reached 62/100. Even the best-scoring sites in this sample didn't clear two-thirds of the scale — nobody in the dataset scored above 62. That ceiling is worth noting: even the strongest small-business websites we saw still had unresolved issues, most often around pricing transparency and page friction.
Which parts of their websites do small businesses get wrong most?
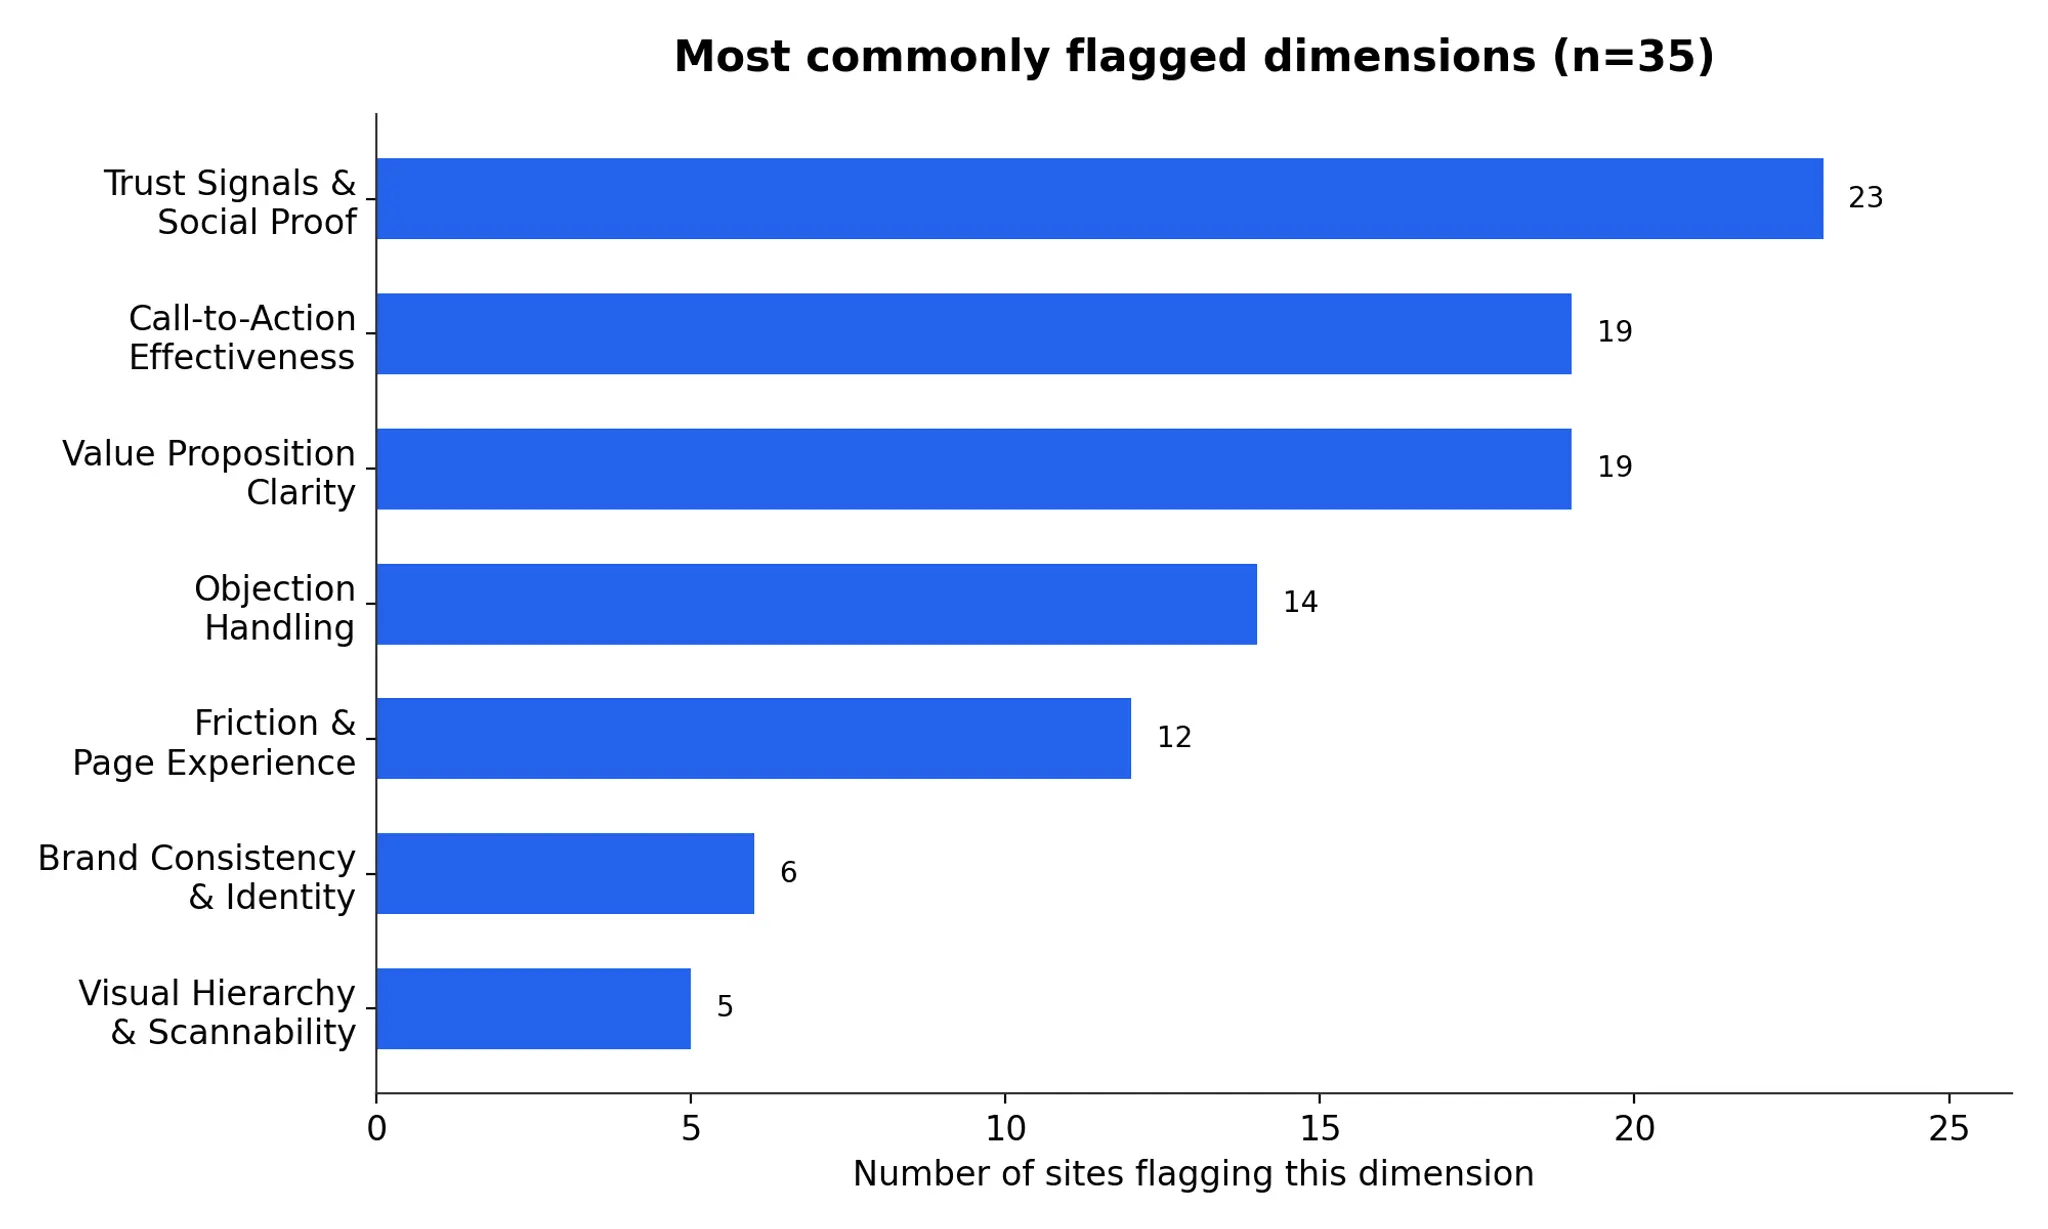
Ranking is based on how often each dimension showed up among a site's top-flagged issues, not a precise numeric average (see methodology notes).
Trust Signals & Social Proof — most commonly failed dimension
The single most common specific failure: no testimonials, client logos, or case studies anywhere on the page. This showed up across businesses of every type in the sample, from law firms to consulting shops to construction companies. What good looks like: Put at least one recognizable client name, logo, or a specific testimonial with a name attached above the fold or immediately below it — not buried in a footer.
Call-to-Action Effectiveness
Most common failure: no CTA above the fold, or several competing CTAs with no clear primary action. What good looks like: One CTA, stated as a specific action ("Get a quote," "Book a call") rather than "Learn more," visible without scrolling.
Value Proposition Clarity
Most common failure: the H1 doesn't say what the business does. Several sites led with just a company name or slogan. What good looks like: The first line a visitor reads should answer "what do you do, and for whom" — not just "who you are."
Objection Handling
Most common failure: no pricing, cost range, or engagement-model information anywhere on the page, forcing visitors to contact the business just to find out if it's affordable. What good looks like: Even a rough starting price or "from $X" range reduces the friction of that first enquiry.
Friction & Page Experience
Most common failure: no lead or contact form on the homepage — the enquiry path required navigating elsewhere. In a few cases, page content failed to render at all. What good looks like: A simple contact/enquiry form visible without leaving the homepage.
Brand Consistency & Identity
Most common failure: inconsistent business naming or conflicting messaging on a single page (e.g., two different service offerings competing for the same visitor). What good looks like: One consistent name, one consistent offer, throughout the page.
Visual Hierarchy & Scannability
Most common failure: missing H1 tag entirely, or navigation menus complex enough to bury the primary action. What good looks like: A clear page hierarchy — one H1, a simple nav, no more than a small handful of top-level choices.
Headline & Messaging
Most common failure: generic headlines that could apply to almost any business in the category, rather than a specific, differentiated claim. What good looks like: State the specific outcome a customer gets, not the industry category you operate in.
Which industries have the best (and worst) websites?
Two clusters in this sample were large enough to report with any confidence. Everything else is grouped below as "Other" because the sample per vertical is too thin (2–4 sites) to generalize.
The 14 professional-services businesses we audited — law firms, consulting firms, HR and corporate-services providers — averaged less than half the score of the 5 fintech/payments companies in the sample. Vertical categorization here is inferred from company names, not confirmed with each business, so treat this as directional rather than definitive. With only 5 fintech sites, we're reporting "the fintech companies we audited," not "fintech companies in general."
How do websites compare across Southeast Asia?
Not filled. Only 6 of the 35 audited sites have a country/market that can be confirmed from the domain or company name (4 Singapore via .com.sg, 1 Philippines, 1 Indonesia by company name). The remaining 29 use generic top-level domains with no reliable geographic signal. Publishing a country-by-country comparison from this would mean presenting 1–4 sites per market as representative of an entire country, which isn't defensible. Recommend either dropping this section for this edition or confirming each business's actual HQ market before filling it in.
What do the top 10% of websites do differently?
The top decile (62/100) sits 24 points above the median (38/100). Based on the flagged-priority text across the five highest-scoring sites versus the rest of the sample, the recurring differences are:
- A single, clear CTA above the fold — not multiple competing calls to action
- At least one visible trust signal (client logos, security badges, or social proof) somewhere on the homepage
- A value proposition stated directly in the H1, rather than just a company name
Worth noting: even the top-scoring sites weren't clean. All five still had flagged issues, most often around pricing/objection handling and page friction — so "what winners do" describes a pattern, not a finished checklist. We don't have permission to name specific businesses in a published report, so no case examples are included here without separate sign-off.
Methodology
Sample: 35 small-business websites, all belonging to businesses encountered at The Business Show Asia on Aug 26–27, 2026. Websites were audited using OhhWells' free website audit tool.
Audited on: Sep 3, 2026
Instrument: OhhWells Conversion Score — 32 automated checks across 8 dimensions.
Limitations:
- Sample size (n=35) is small for a regional benchmark claim.
- All 35 businesses were sourced from a single event over two days — this is a convenience sample, not a random or representative one, and the report should say so rather than imply broader SEA coverage.
- Vertical categorization was inferred from company/domain names, not confirmed with each business — some may be miscategorized.
- Country/market could not be reliably determined for the majority of the sample; no regional breakdown is included.
- Dimension-level scores in this draft are based on which issues were flagged as "top priorities," not exact numeric averages per dimension — precision here depends on access to the underlying data export rather than PDF screenshots.
Citation line: Source: OhhWells 2026 SEA Small-Business Website Benchmark (pilot, n=35)
What's your score?
The small-business websites we audited scored 35/100 on average. Find out yours in under a minute — free, no signup required.
Run your free Conversion Score audit
Check for freeFrequently asked questions
https://www.ohhwells.com/free-tools/website-audit/

Keep reading
OhhWells vs. The Field: Agency Website Platform Price & Value Comparison
How OhhWells compares on price and value against GoHighLevel, Webflow, WordPress, Wix Studio, and Brizy — one table, every platform.
Lovable vs Bolt: Which AI App Builder Should You Actually Use?
Lovable vs Bolt, compared honestly: how their pricing actually differs, where each wins, and the team-pricing gap most comparisons miss.
Best AI for Website Design (2026): An Honest Guide for Small Business Owners
A plain-English comparison of the best AI website design tools in 2026 — what each is good at, and why looking good isn't the same as converting.
AI Website Builder
AI website builders are free to build, paid to publish. Here's what nine builders actually charge for domains, payments, and bookings — and how to pick.
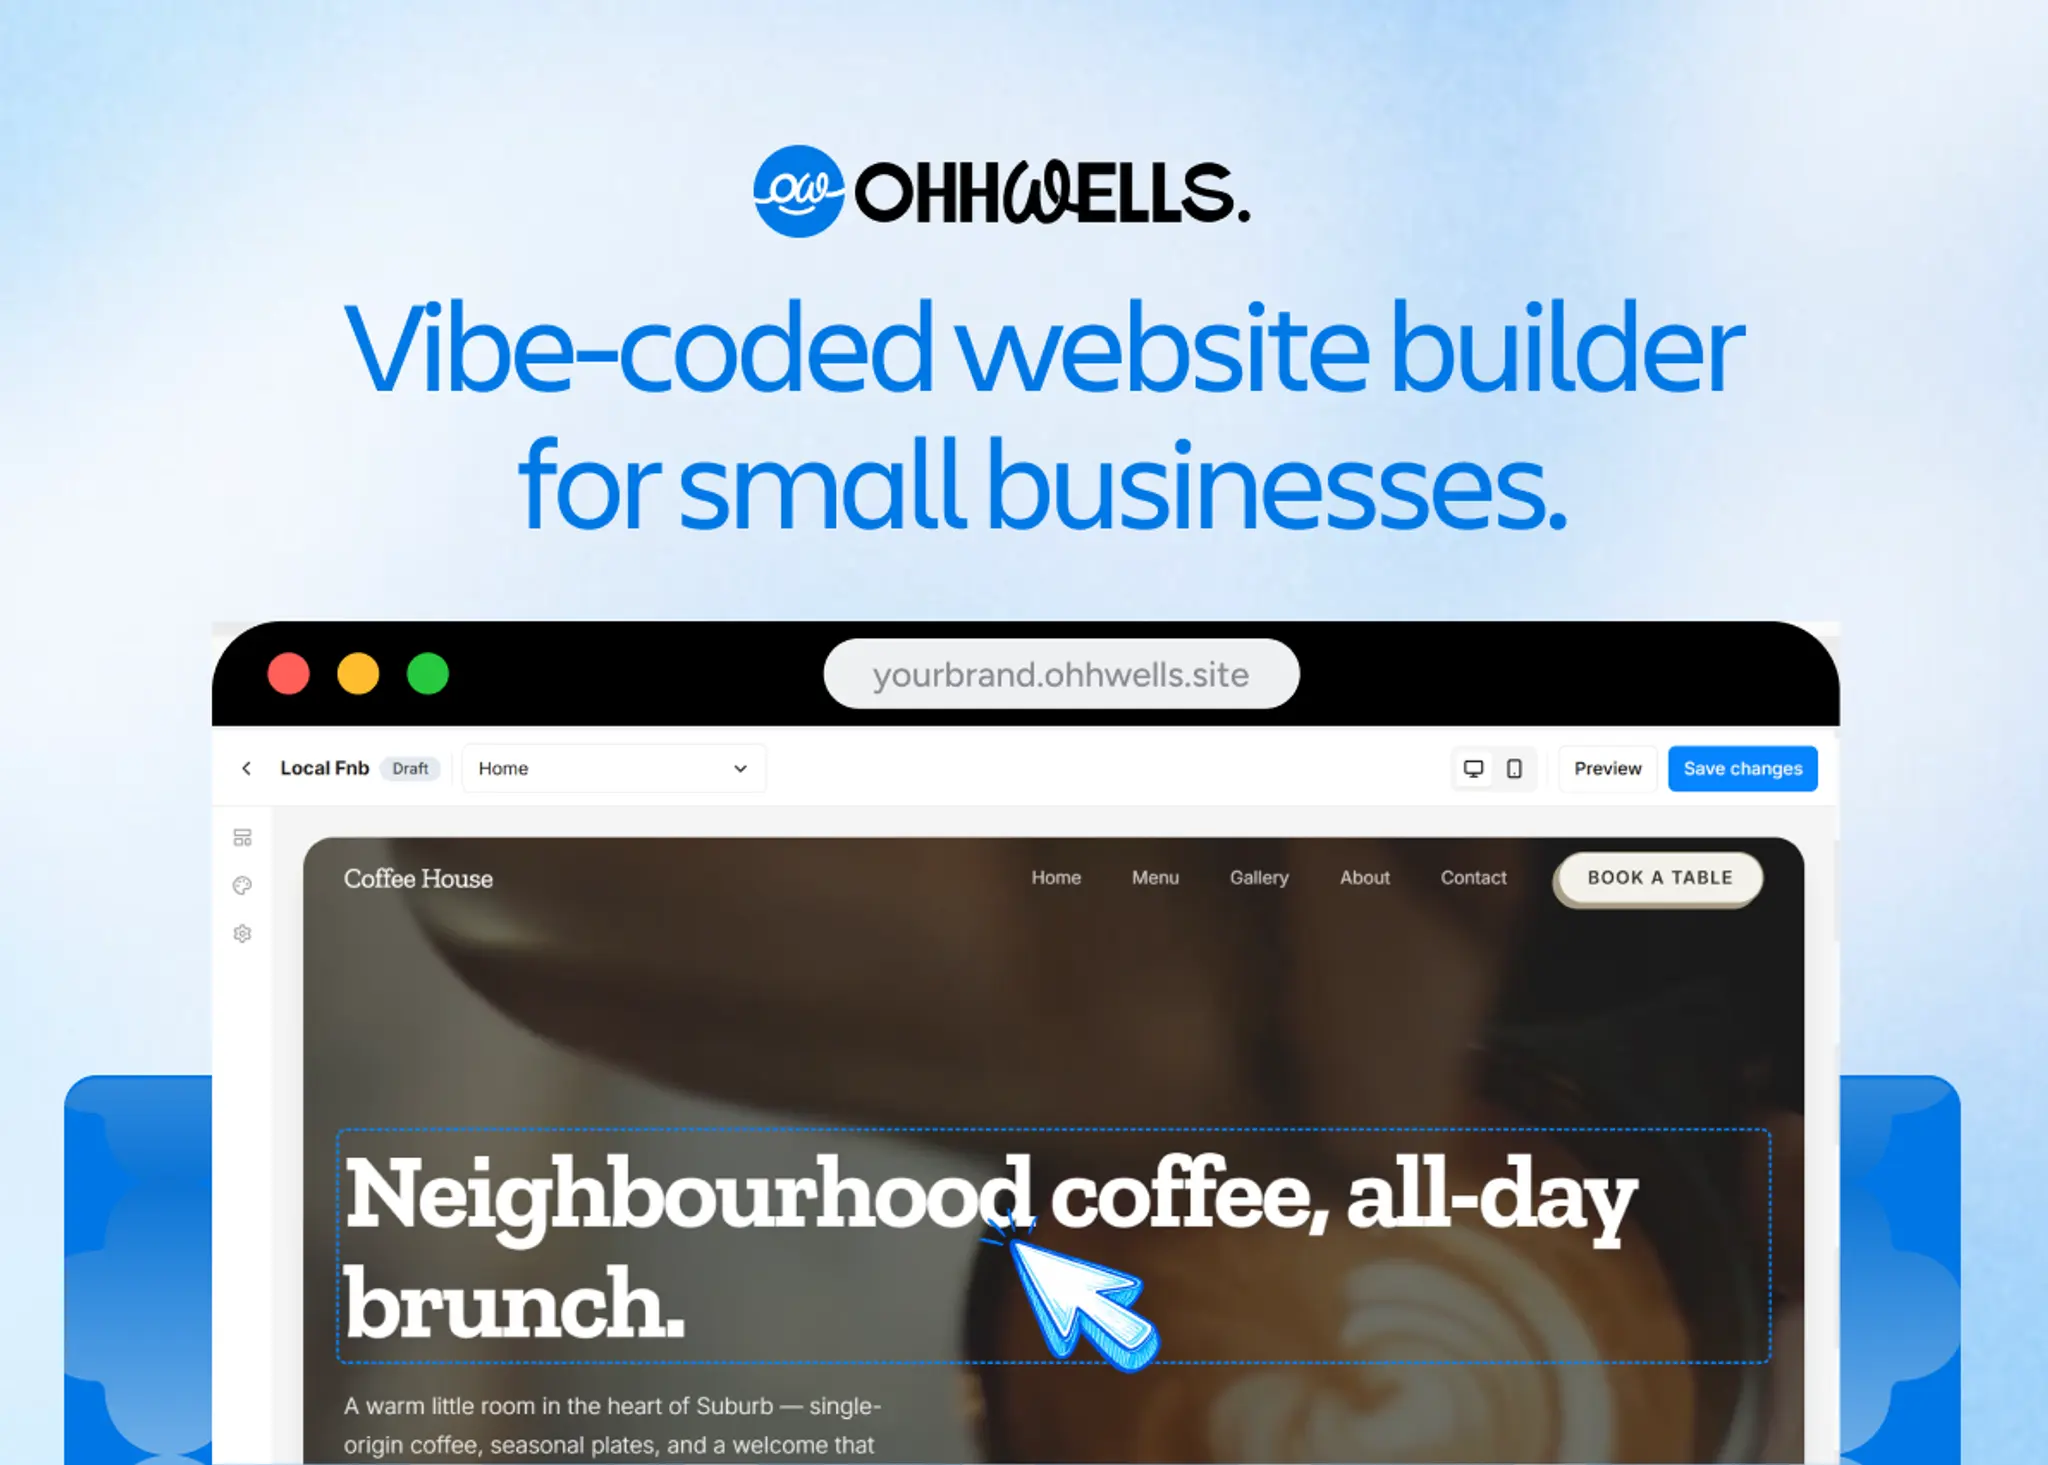
AI Website Builder for Small Business: An Honest Guide (2026)
AI can build your small business site in minutes — but it'll look like everyone else's. Here's how to pick the right builder and fix what breaks after launch.
Best Free Website Audit Tools for Small Businesses
9 free tools, one big blind spot. Here's what each one checks — and the one thing none of them tell you.